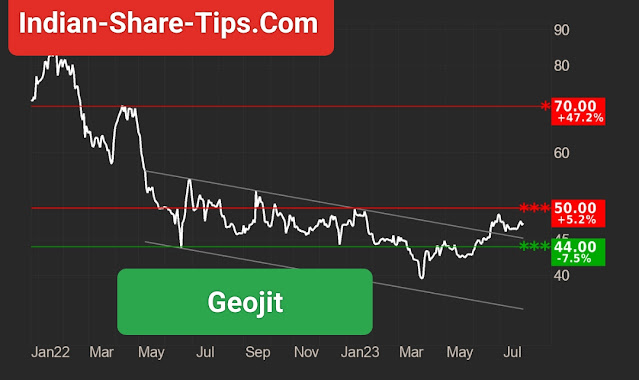
Geojit Financial Services Ltd. has broken
through the ceiling of a falling trend
channel in the medium long term. This
indicates a slower falling rate initially, or
the start of a more horizontal development.
It also gave positive signal from the
inverse head and shoulders formation at
the break up through the resistance at
44.43. Further rise to 50.77 or more is
signaled.
The moving average indicator has
given a positive signal. In isolation, this
signals a continued rise, but the slowness
of the indicator often means that one has
lost much of the upside. The stock is
approacing resistance at 50.00 rupee,
which may give a negative reaction.
However, a break upwards through 50.00
rupee will be a positive signal. Volume has
previously been high at price tops and low
at price bottoms. This strengthens the
stock. The stock is overall assessed as
technically positive for the medium long
term.


